The Urban Institute is a nonprofit research organization founded on one simple idea: To improve lives and strengthen communities, we need practices and policies that work. By equipping changemakers with evidence and solutions, together we can create a future where every person and community has the opportunity and power to thrive.
TOPIC AREAS
Community Development
Economic Inclusion
PROJECT TYPES
Digital & Physical Tools
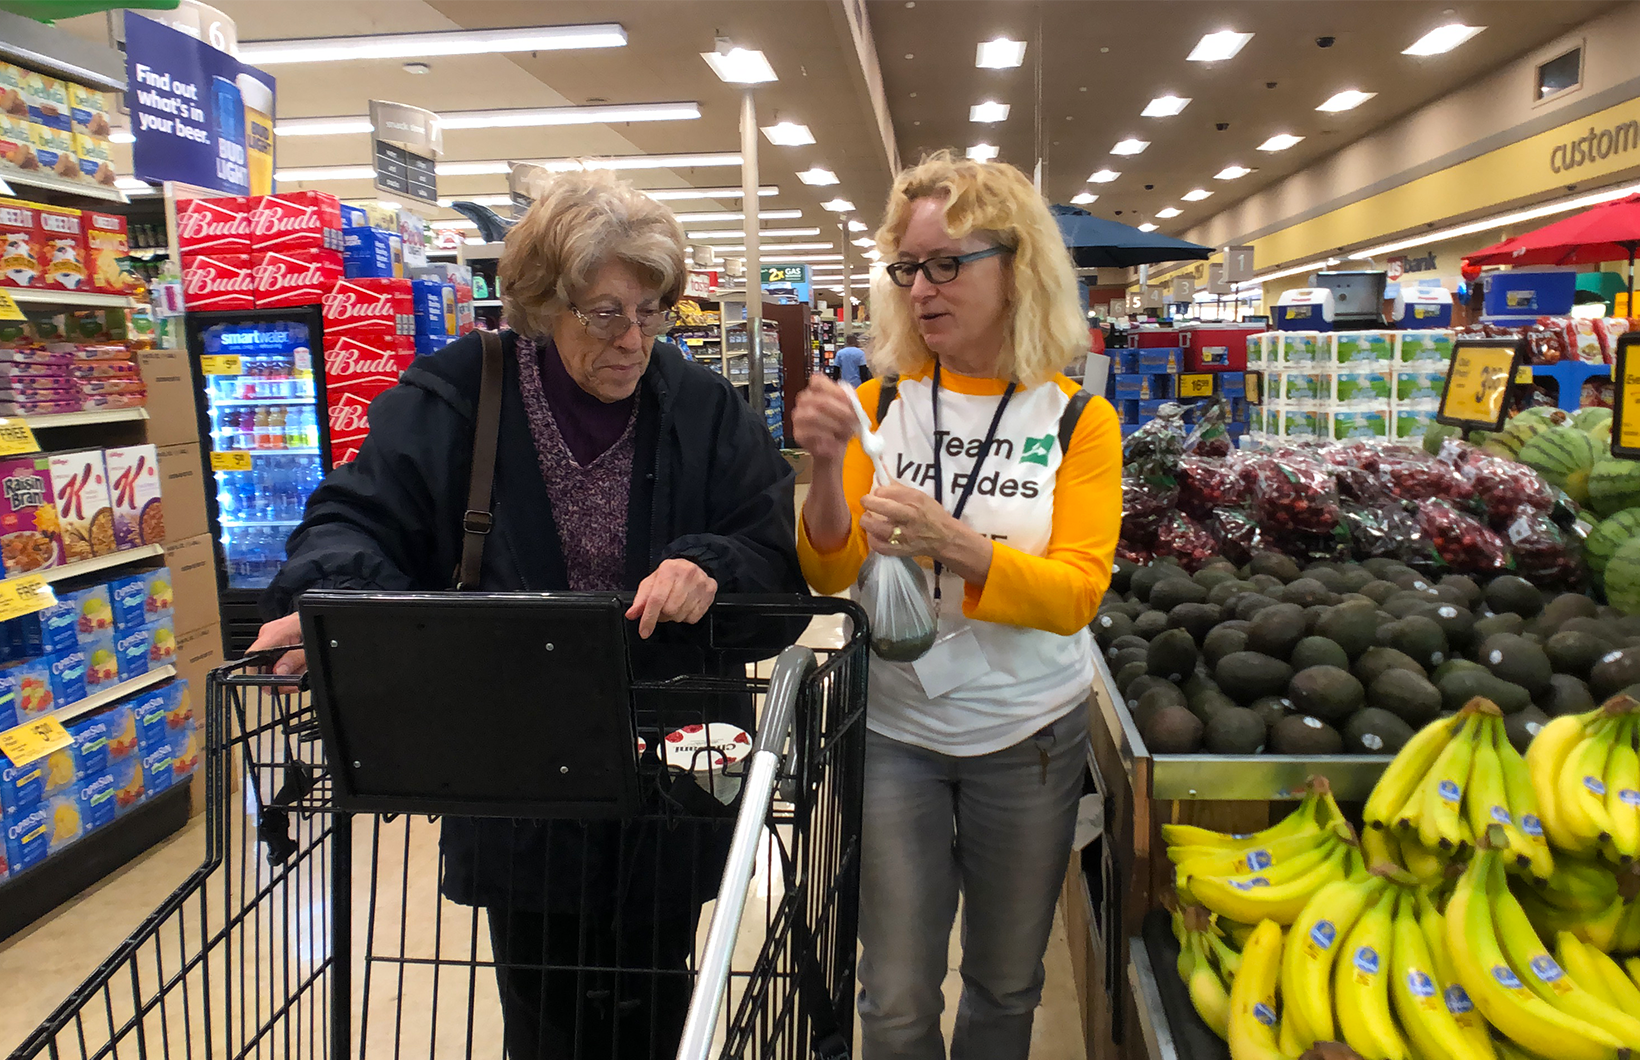
Many local leaders want to help their residents move out of poverty, but lack the information they need to reach this goal. As part of their Upward Mobility Initiative, Urban Institute sought to equip local leaders and changemakers with data and support tools to improve upward mobility from poverty and address barriers to racial equity in their communities.
While Urban had an existing website that featured data tables for every U.S. county and over 480 U.S. cities, they recognized an opportunity to make the data more engaging and accessible to a broader range of constituents.
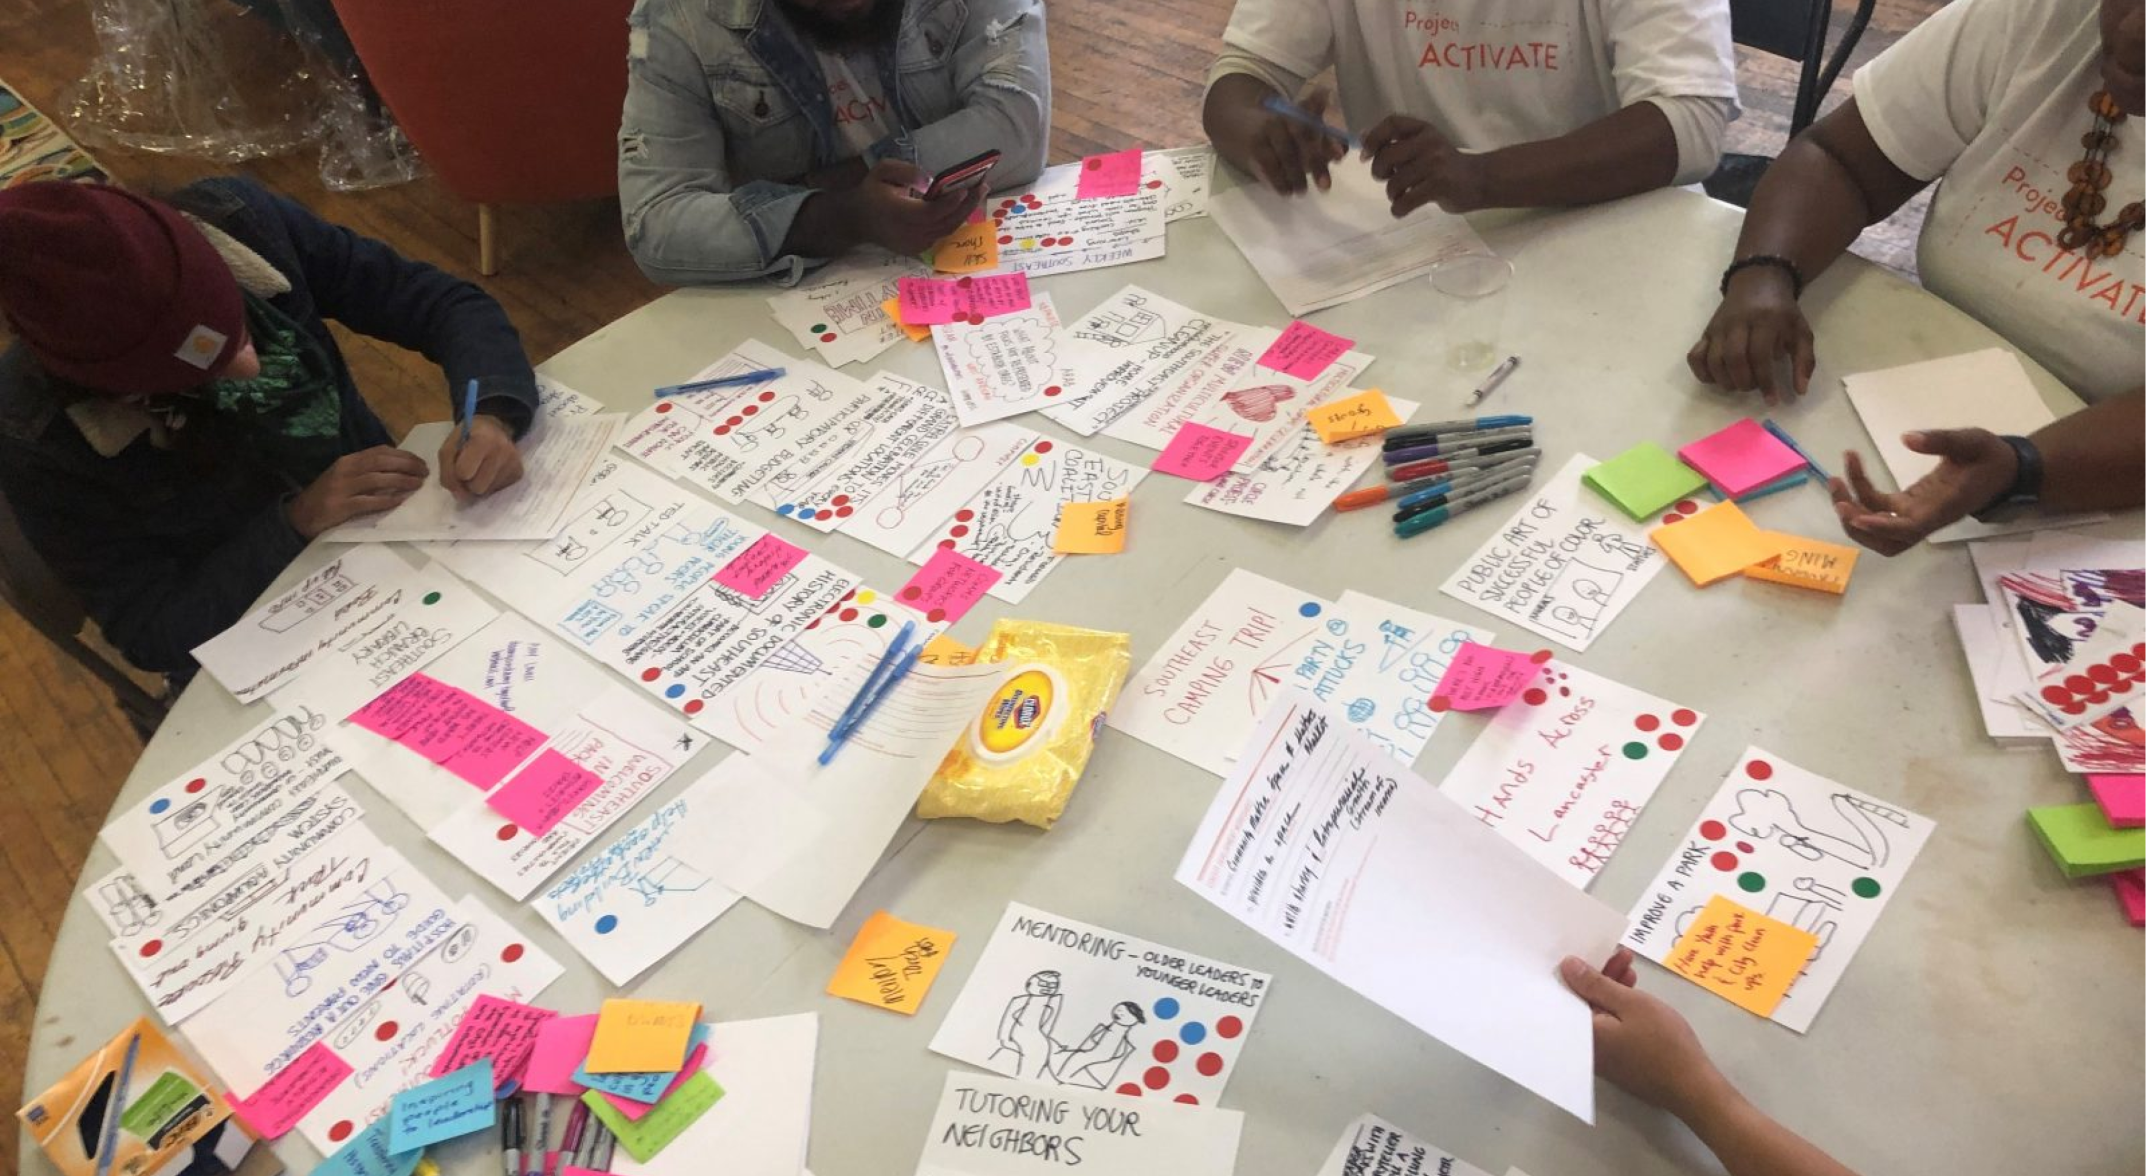
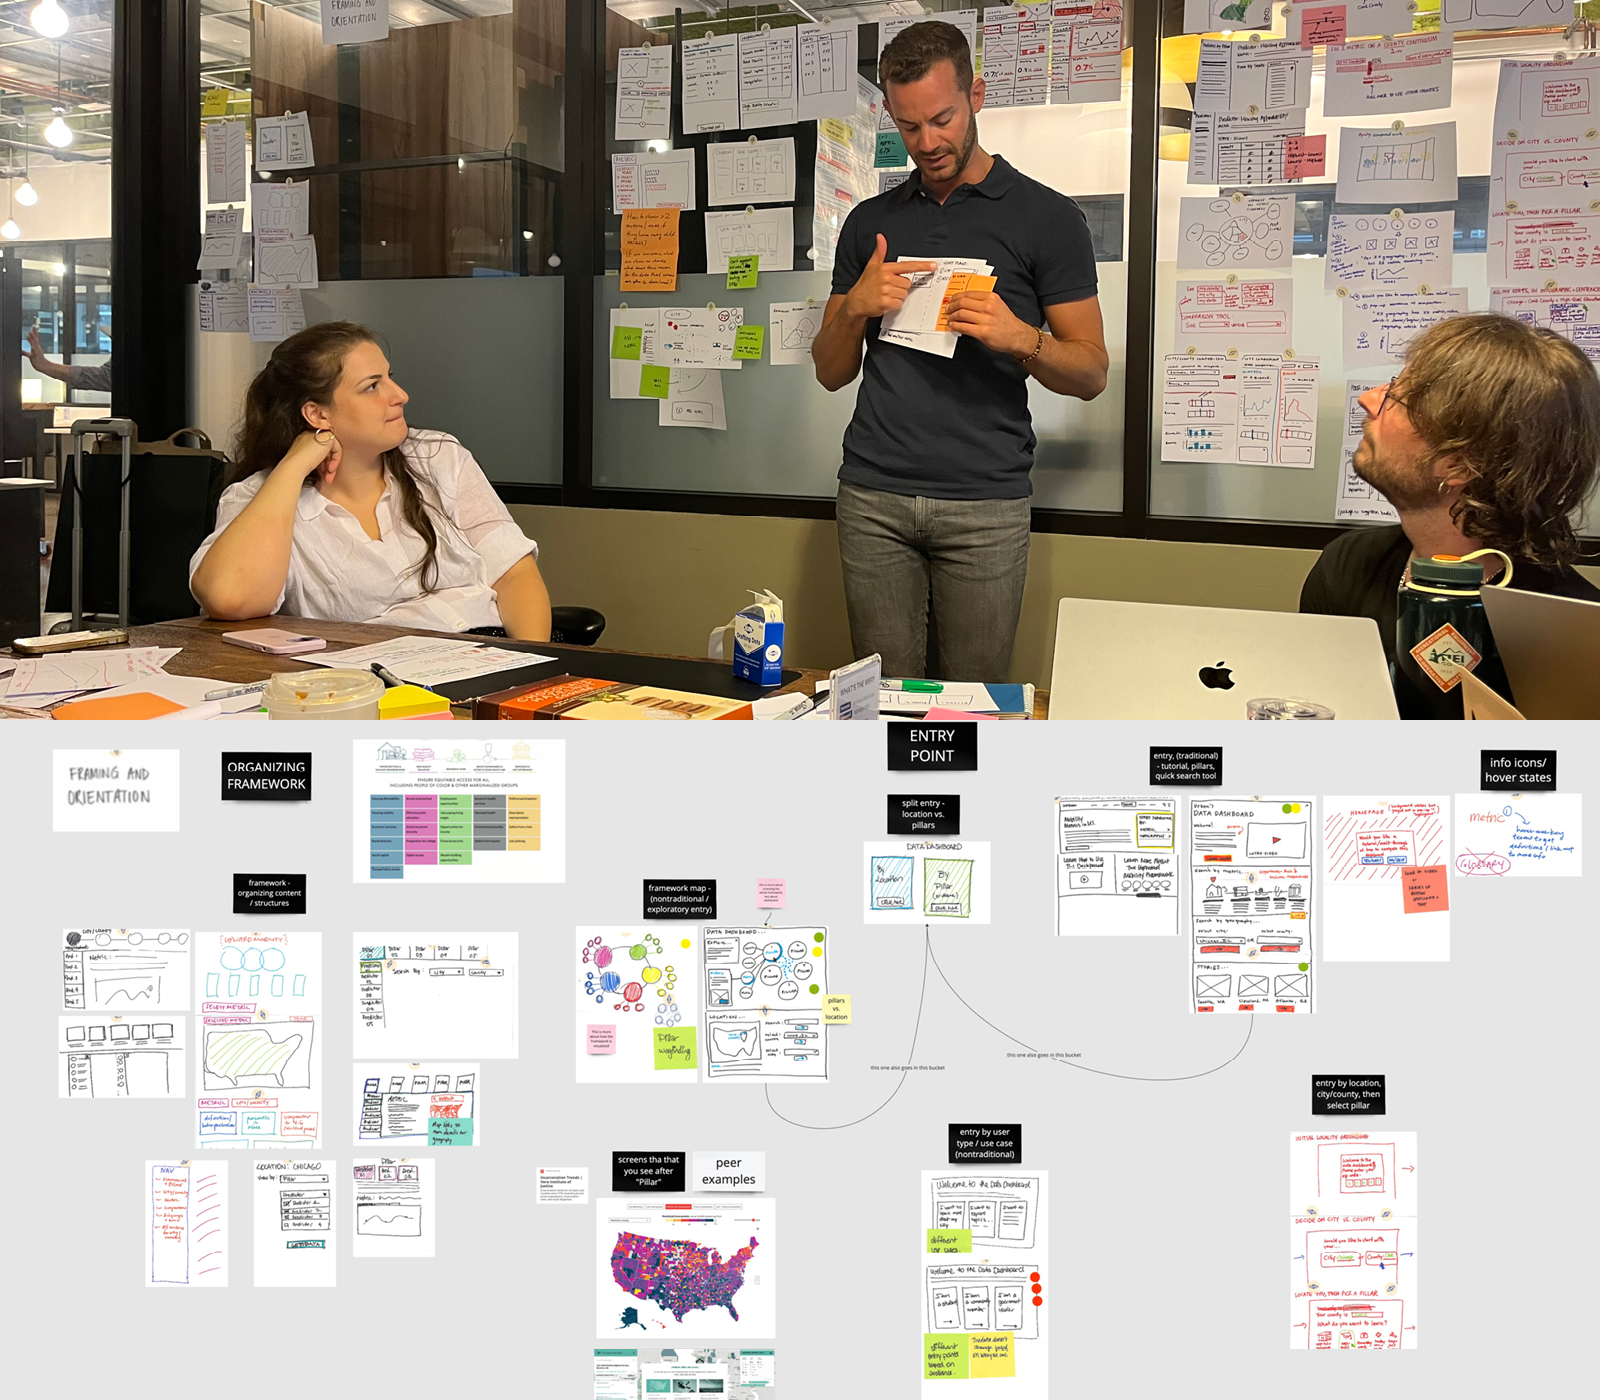
We partnered with Urban to design the Upward Mobility Data Dashboard, through a co-creative process with a range of local leaders across a spectrum of data literacy — or the ability to read, understand, and work with data. This human-centered process ensured the tool was inclusive, engaging, and accessible. Read more to understand our partnership and process.
Project Outputs
We created new designs for a data dashboard that launched in fall of 2024. More specifically, our final screen designs included specifications for overall structure of the data dashboard, user interactions across various types of data, and the visual styling of the pages and components for different devices. The data visualizations were provided by Urban’s data visualization team. These designs were presented and reviewed with the Urban team and their development partner to support a fluid hand-off between design and development teams.
Select Dashboard Designs

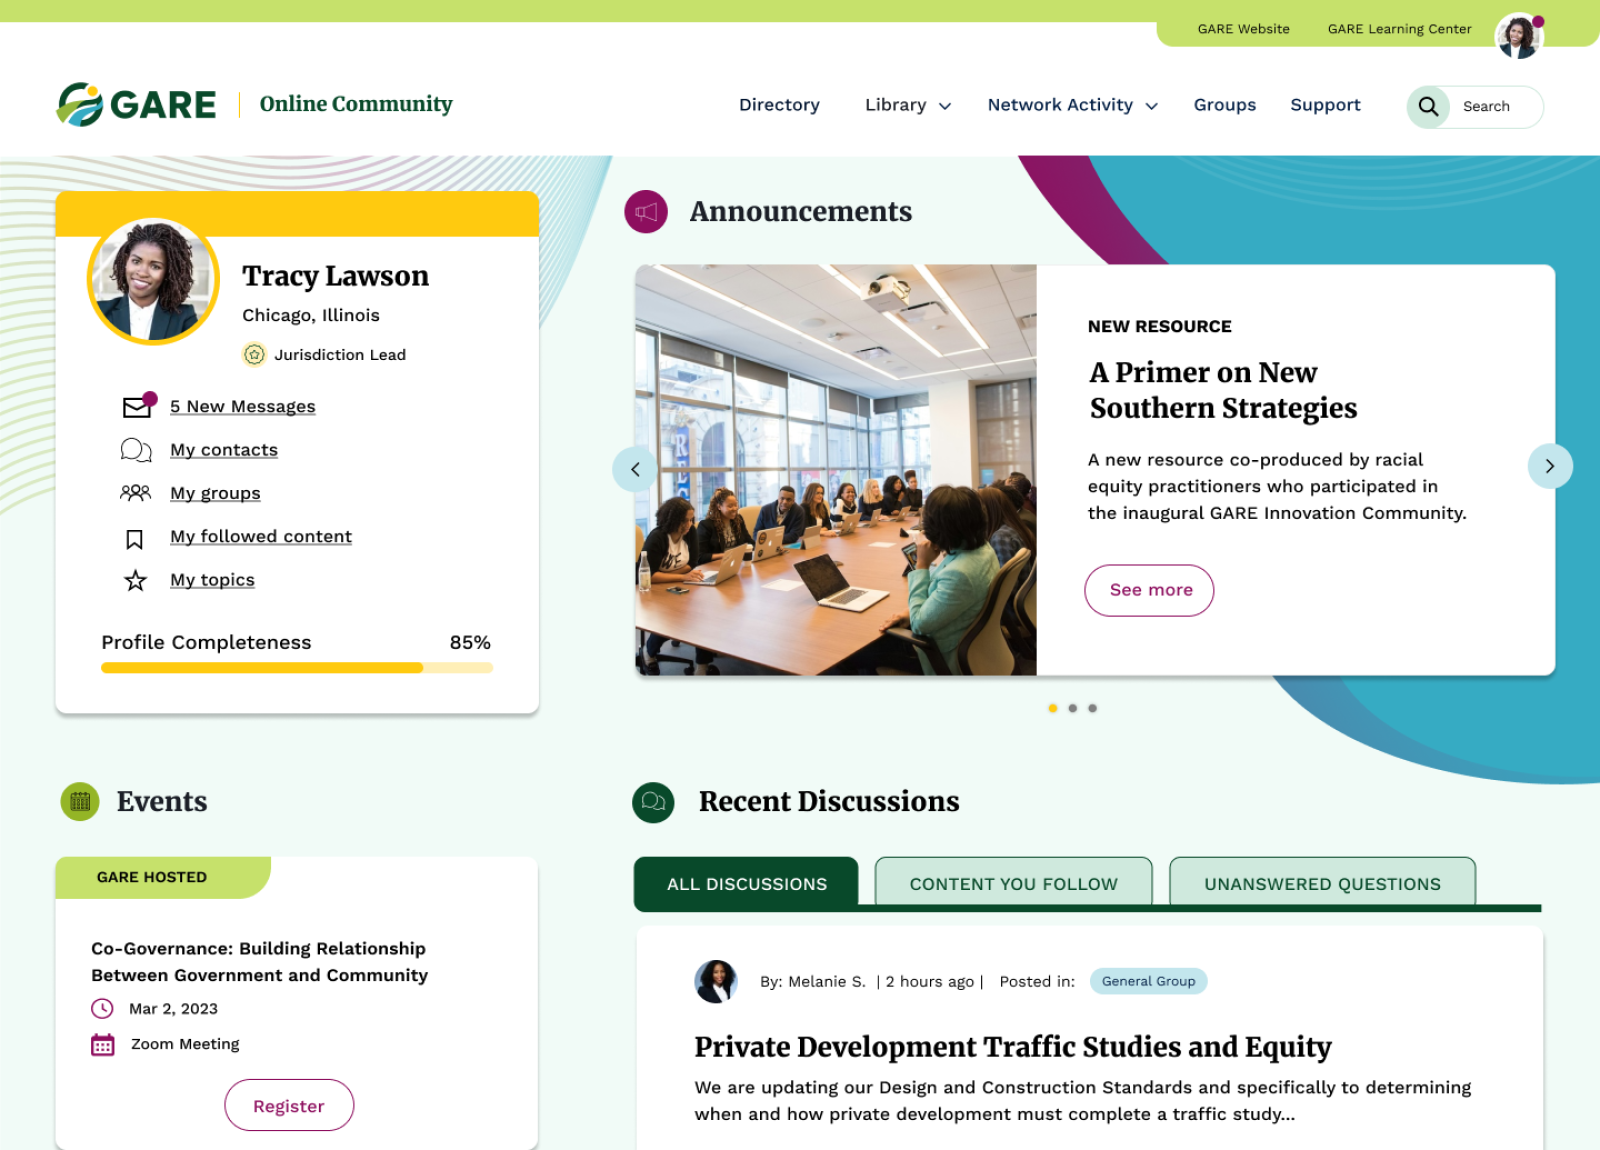
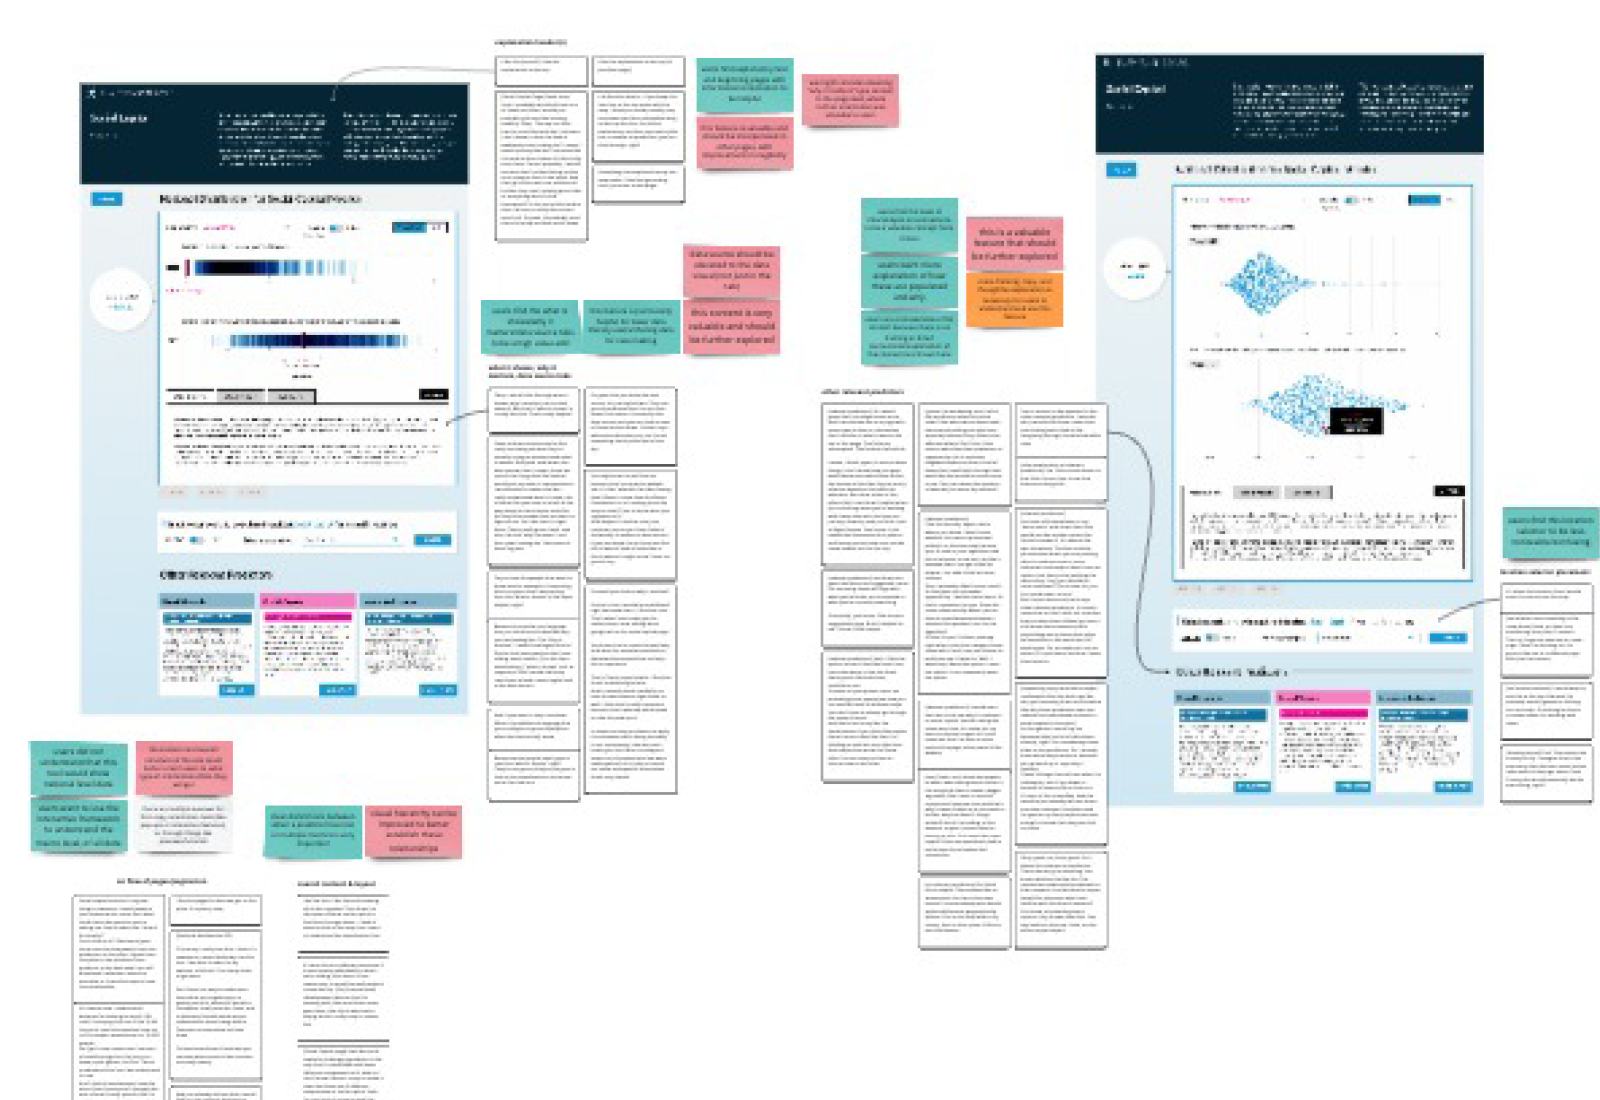
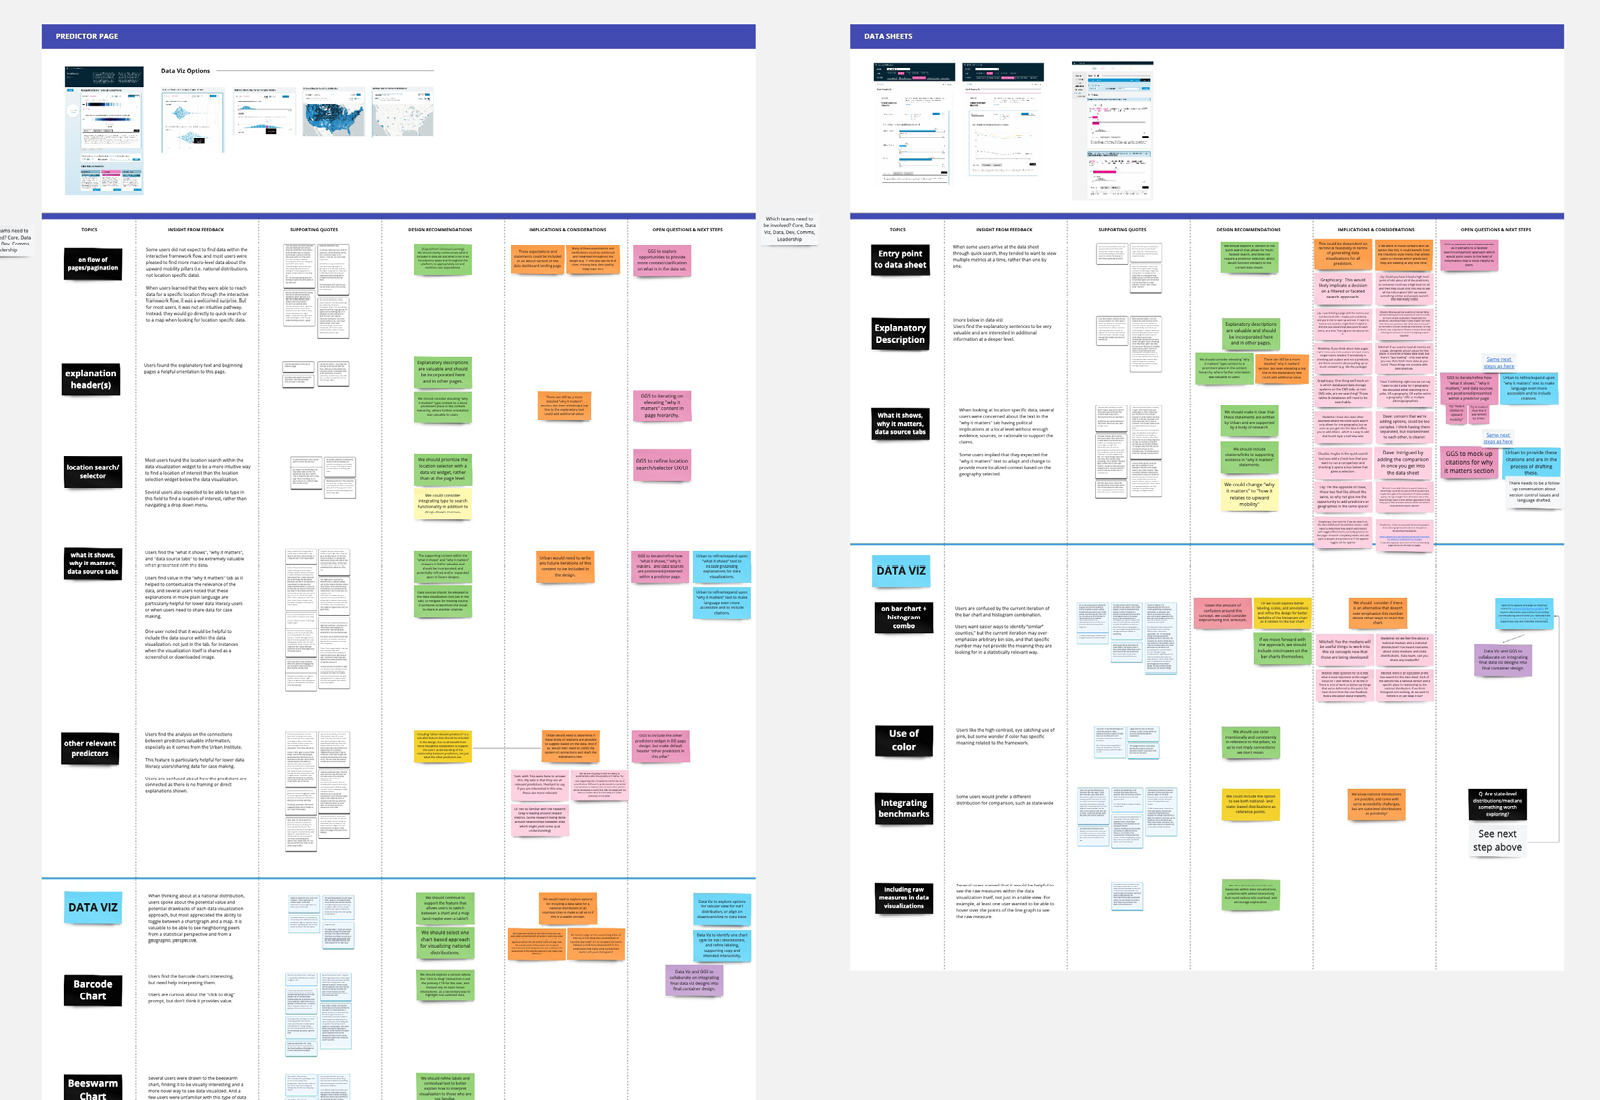
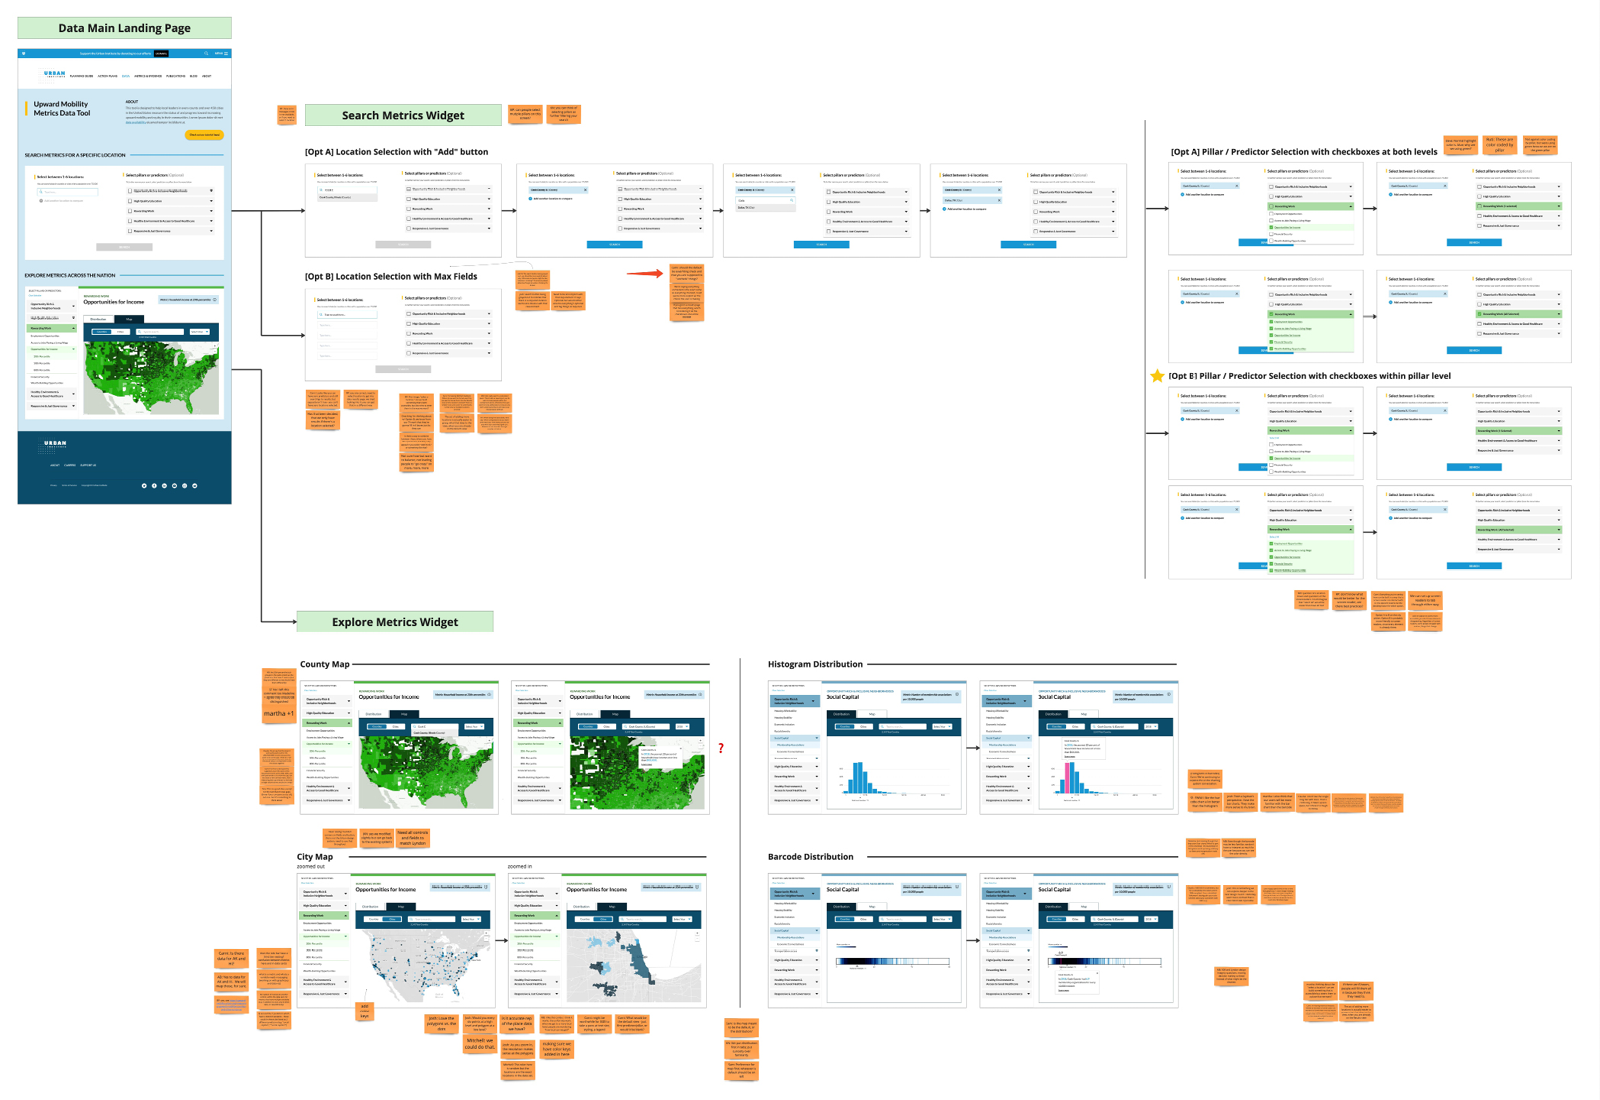
The landing page of the data dashboard provides grounding context and an orientation tour, and features two entry points into the data: search or explore. A more robust search functionality enables users to select multiple communities for direct comparison and to customize the pillars or predictors based on their interests and needs.
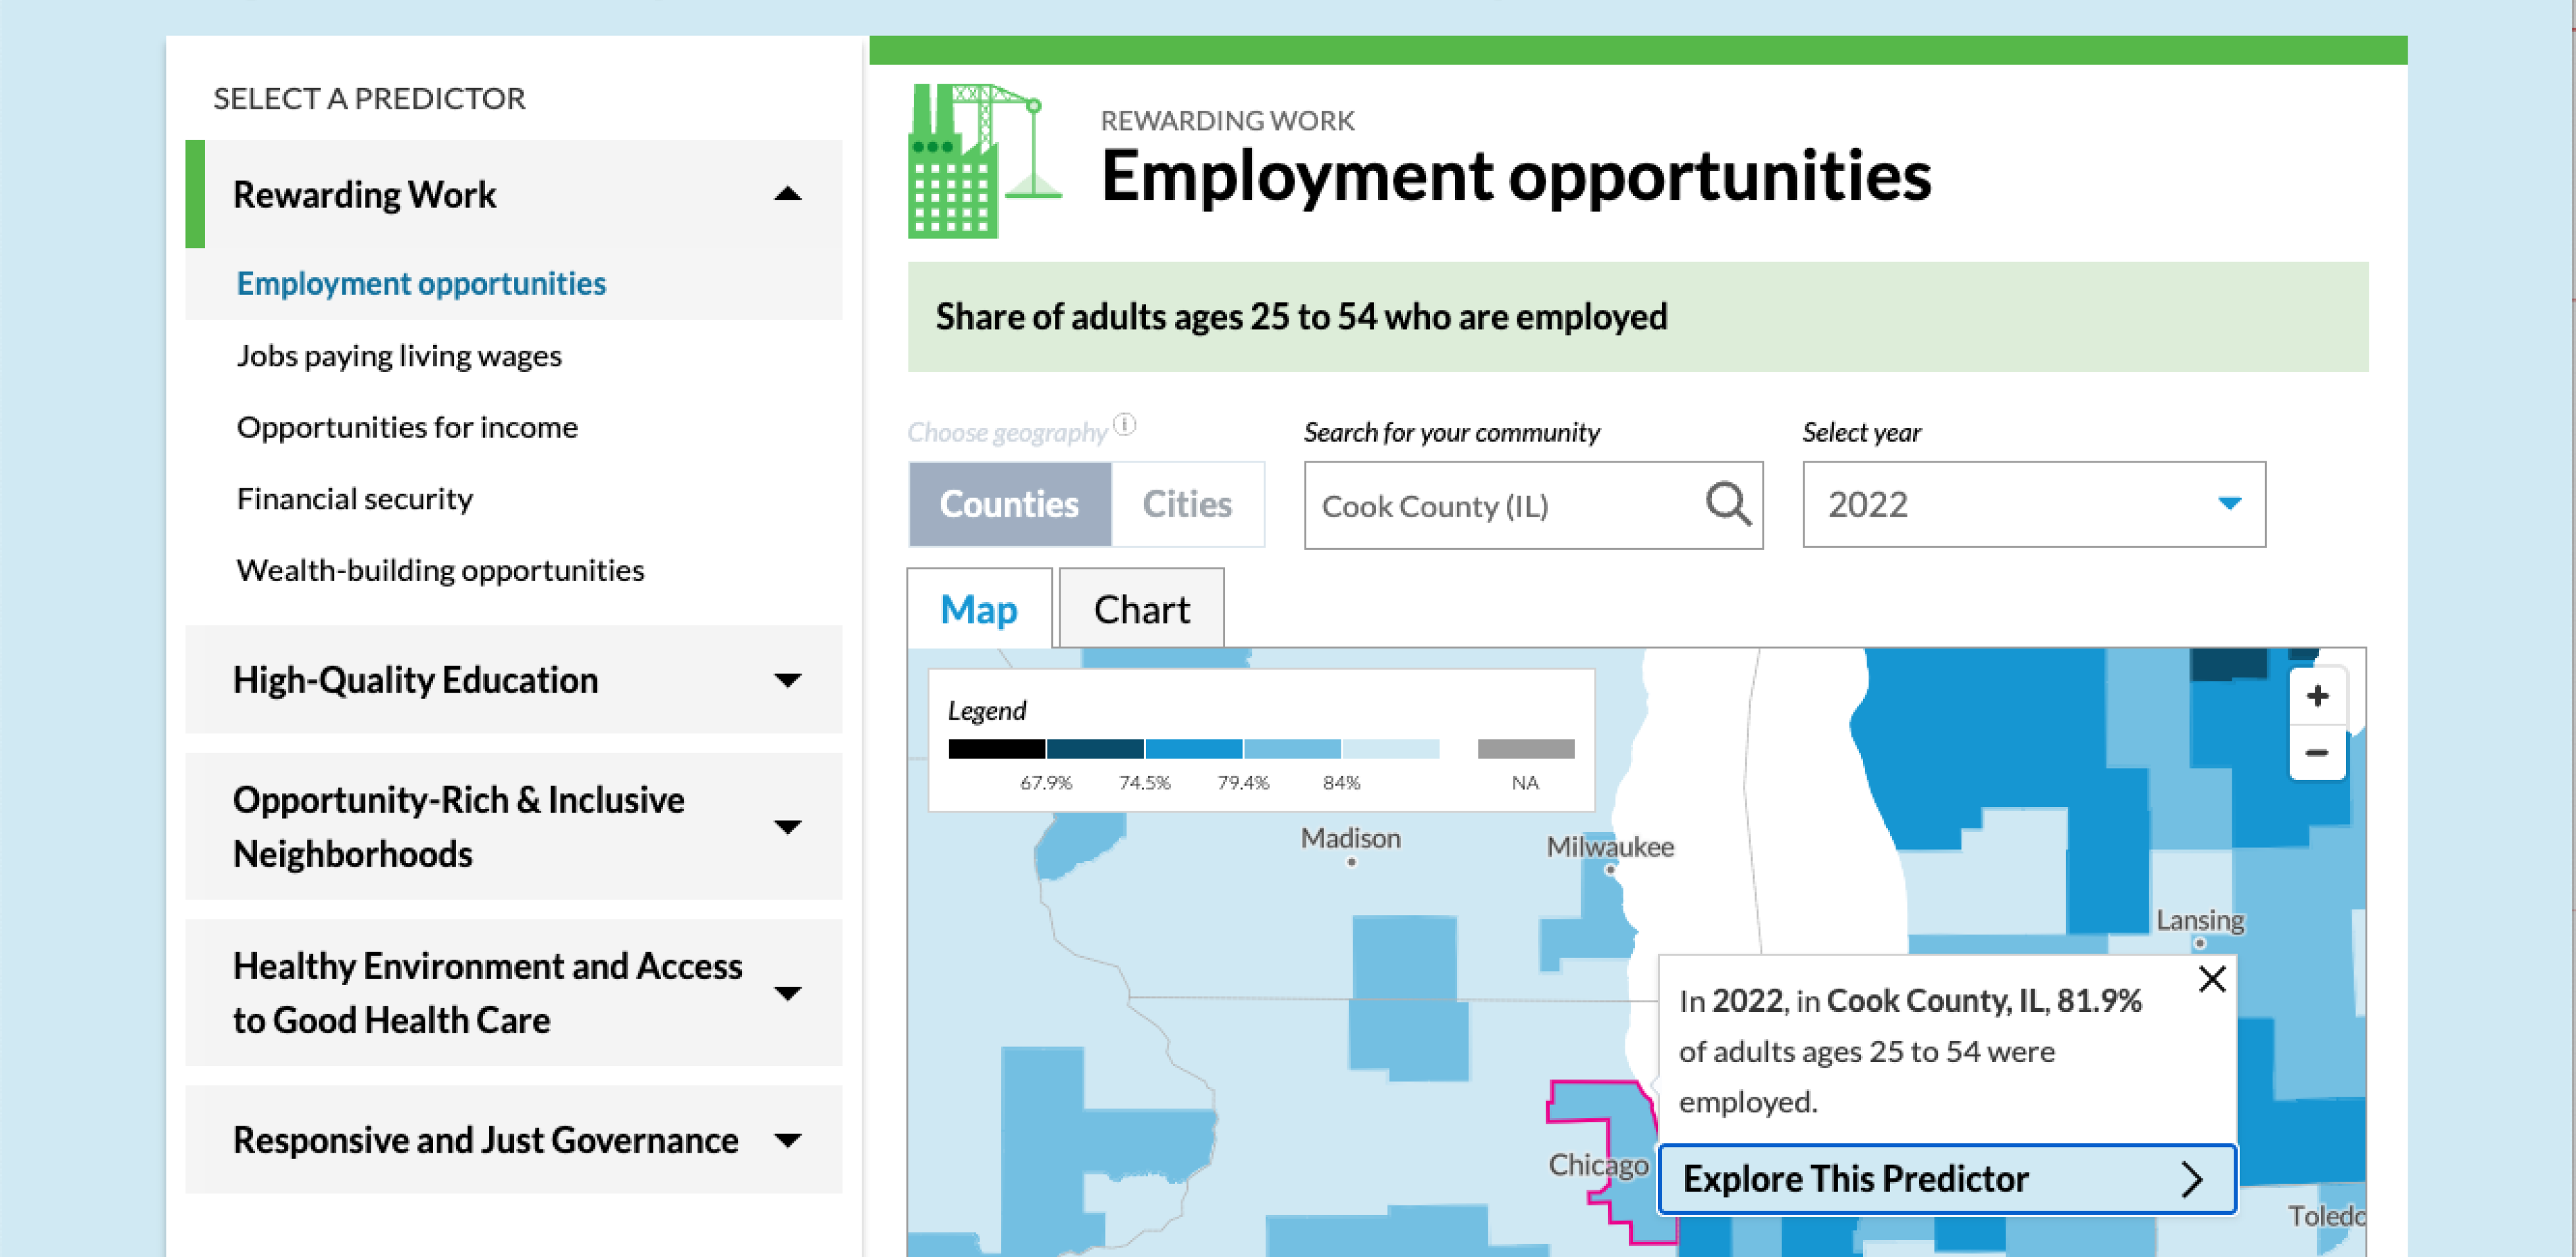
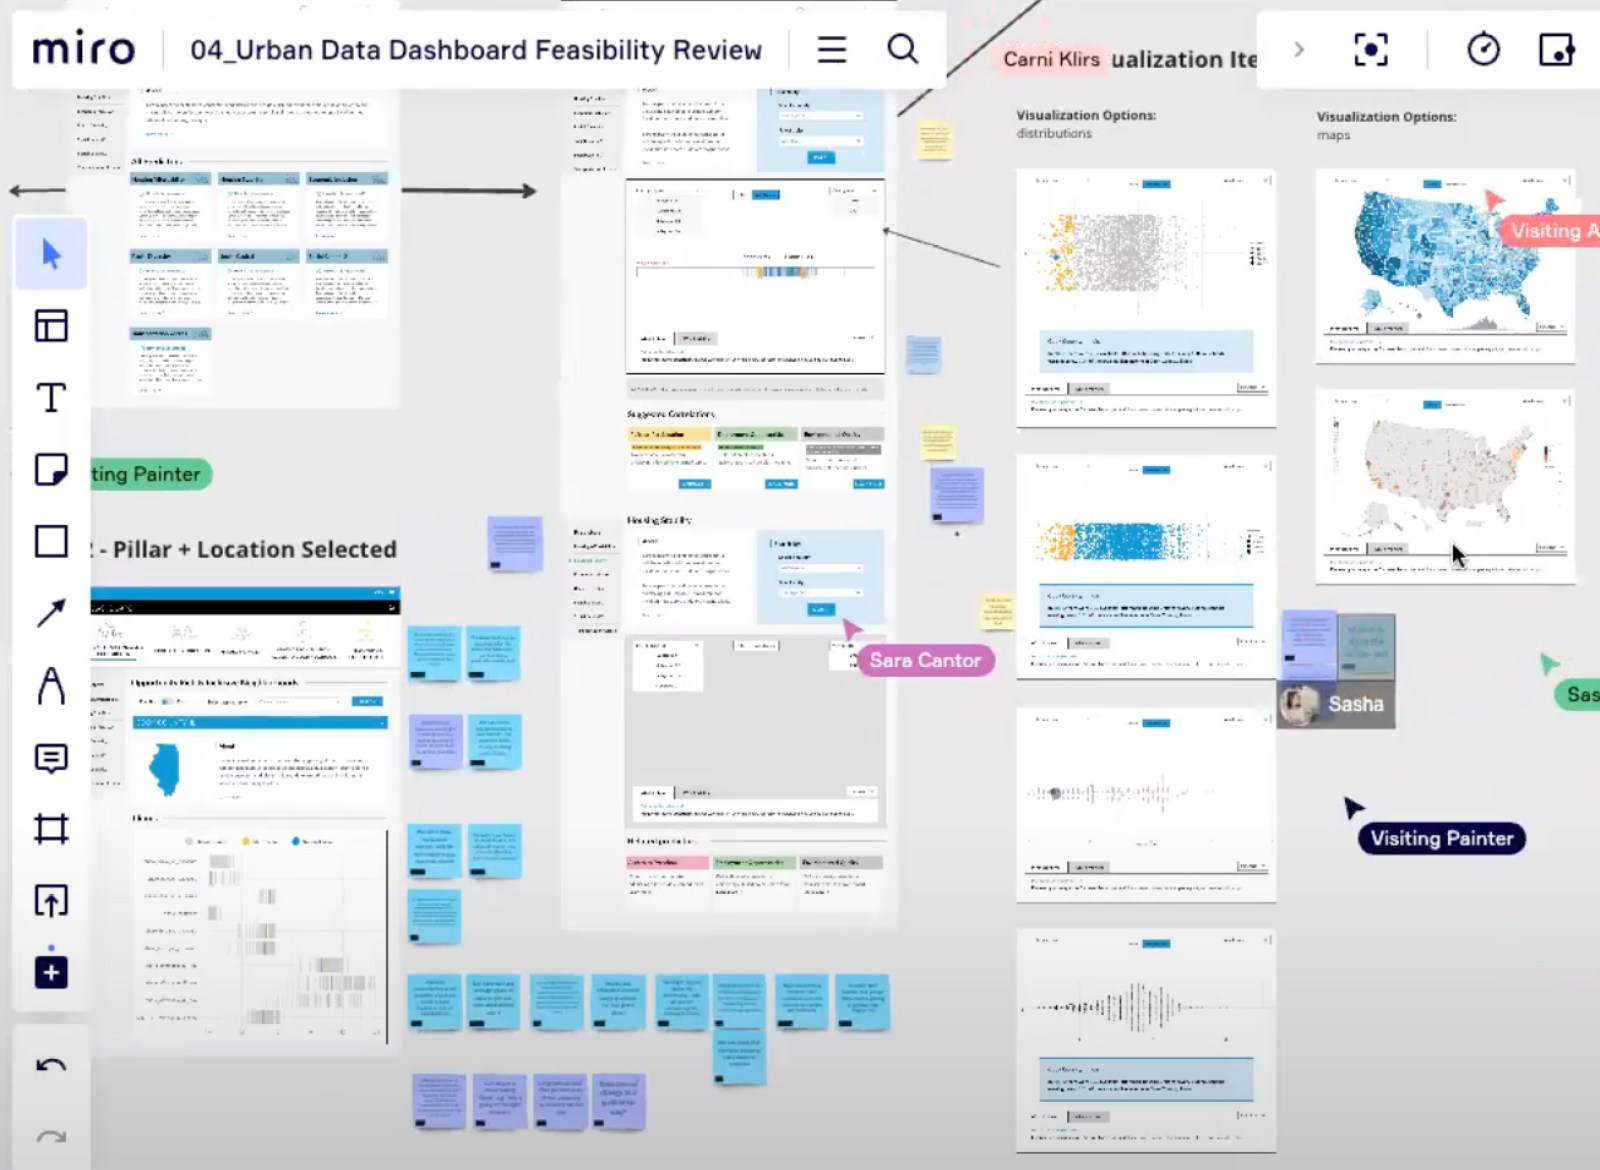
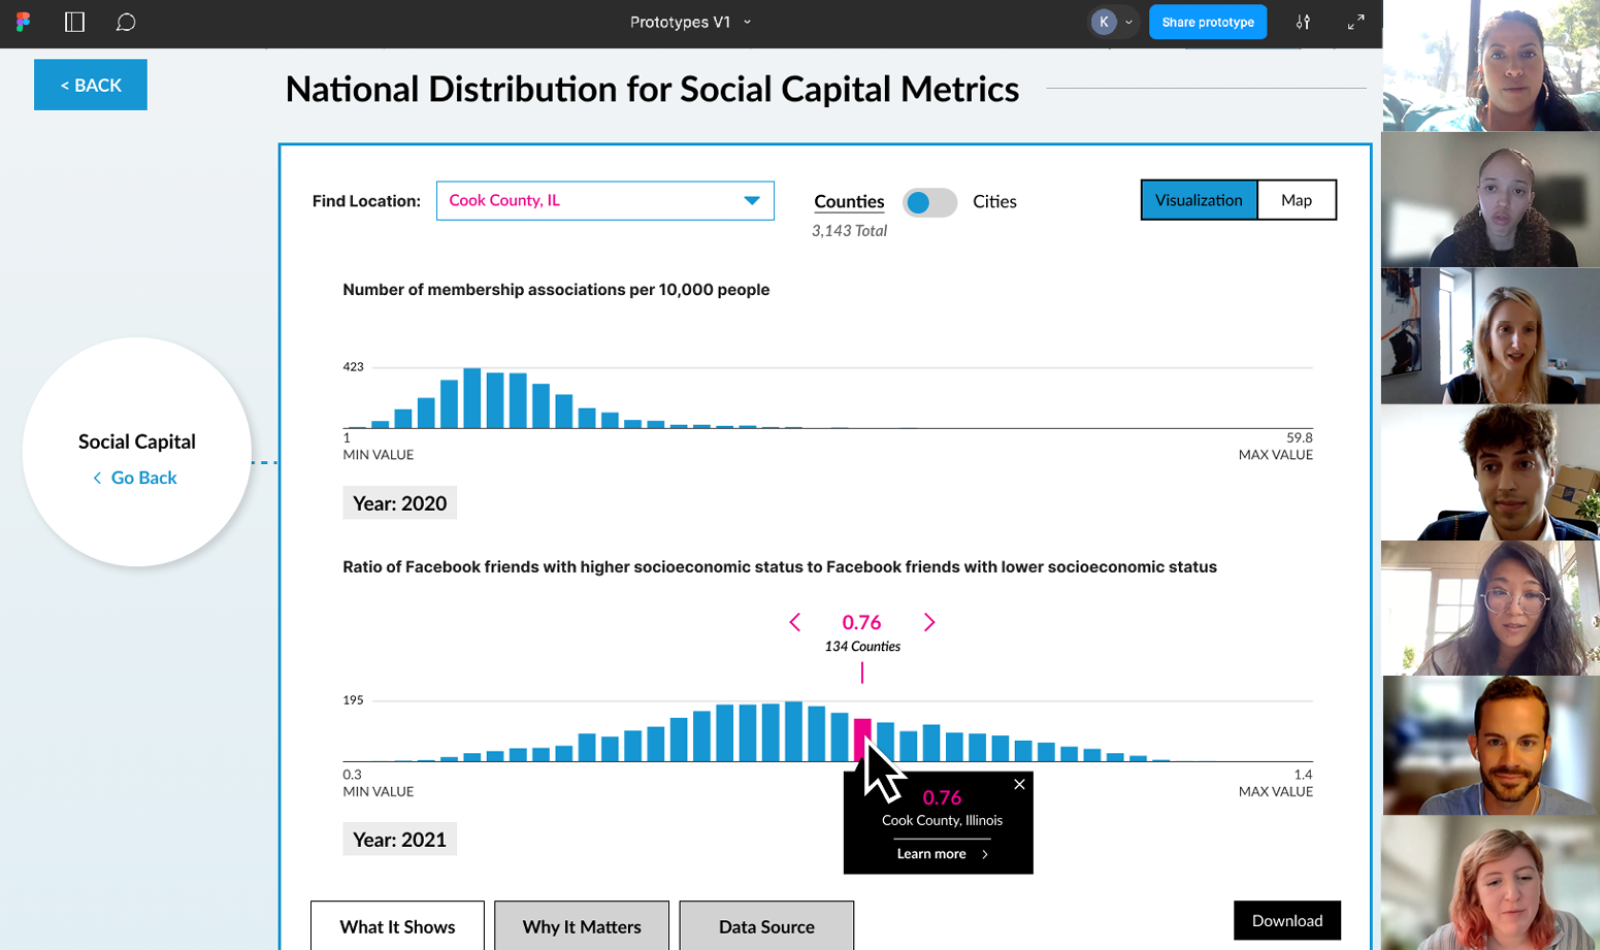
Users can also explore country-wide data for a chosen Mobility Metric via dynamic maps and distribution charts. From there, they can dive into a single location and see more details in interactive data cards.
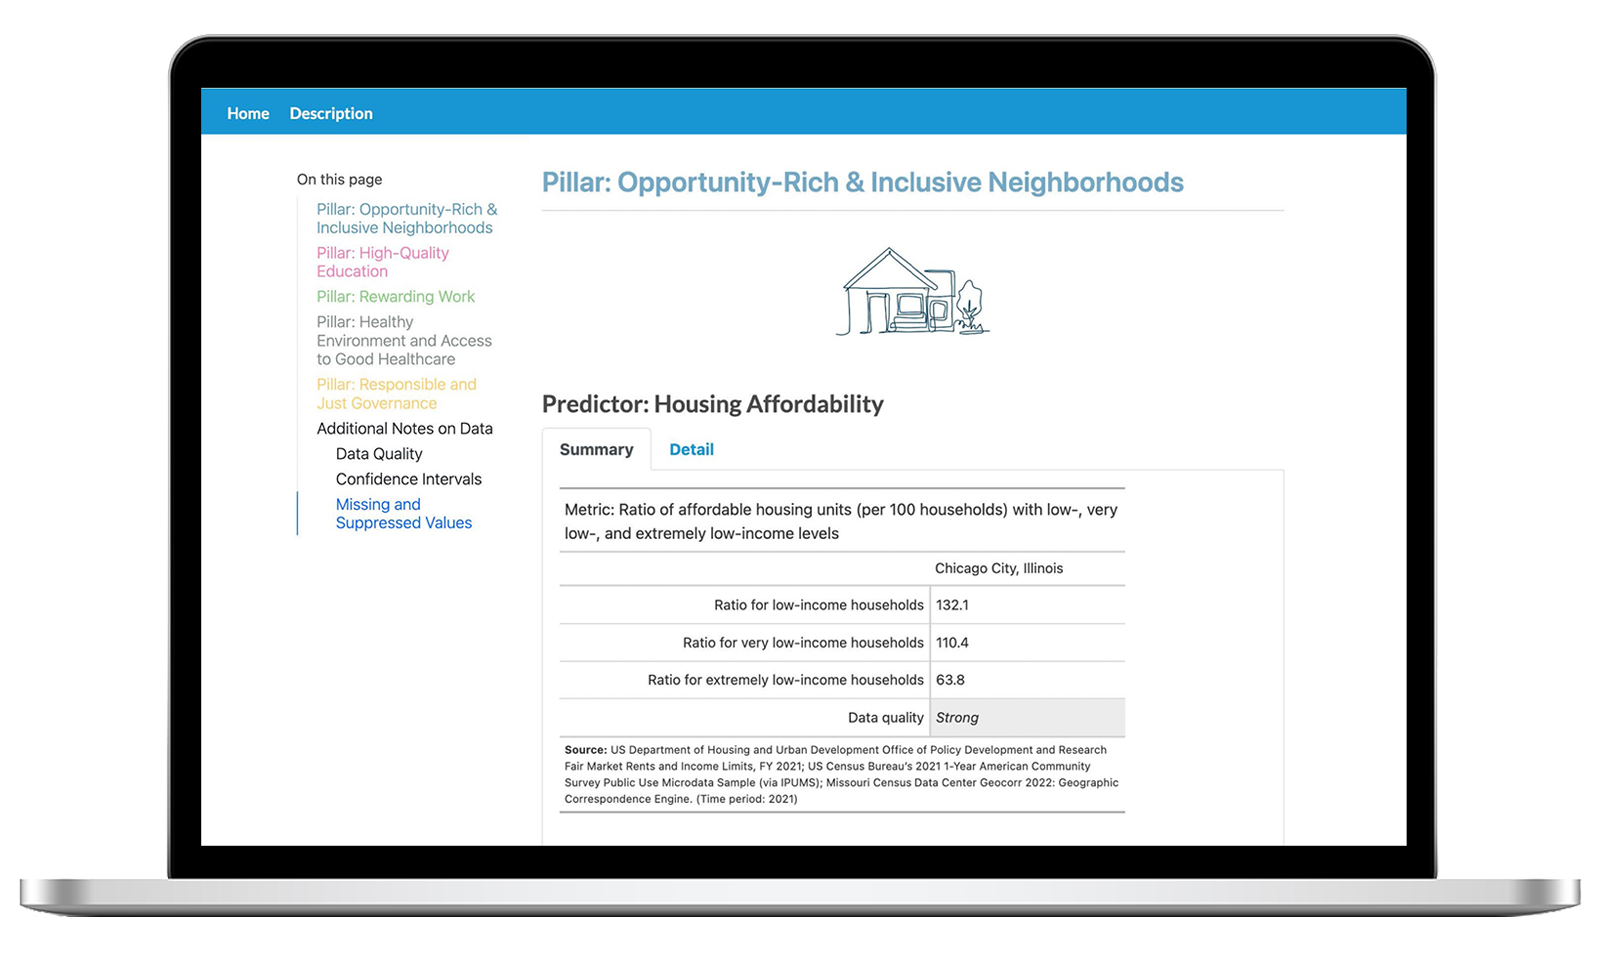
The interactive data cards present a snapshot of the community’s data, and also allow people to expand the card to view data in different visual formats, in specific years or over time, and examine differences across racial and ethnic groups, age ranges and gender identities to understand how predictors affect different populations.
Users can change or add up to 6 communities for comparison across all metrics, and can also receive suggestions for peers they might want to compare themselves to using the Suggested Peers feature. Peer community suggestions are determined using data on demographics, housing, population, and geographic proximity to calculate an overall measure of similarity between two cities or two counties.
Users also have the ability to download datasets and the dashboard’s charts for use in other platforms and materials. They can also share links to specific data cards with community members and colleagues.
To encourage informed action and deeper understanding, the dashboard directs people to helpful guides for making sense and use of the Mobility Metrics, examples of promising local policy interventions, and supporting evidence and source material for each metric.

Client & Community Outcomes
Deeper understanding and integration of human-centered design at Urban
As a key part of Urban’s Upward Mobility Initiative, the creation of a Data Dashboard provided an opportunity to apply a human-centered design process—ensuring that the tool was truly aligned with the needs of local leaders and changemakers. While there was strong support for human-centered design from both Urban and the funder, this approach was relatively new to the organization.
Throughout this project we observed the Urban team embrace human-centered design principles, especially as we finalized the design direction. In one pivotal moment, a team member advocated for a design choice that prioritized user needs over technical feasibility, drawing on insights shared by prototype feedback participants. Several Urban team members took part in a generative sketching session, where they visualized and iterated on early ideas. Additionally, Urban team members reviewed user feedback, leading the team to prioritize data visualizations that more effectively met users needs.

Earlier on, there was this assumption that HCD could help us move quicker. But we learned that it takes more time to be more thoughtful. The thoughtfulness of this process helped to bring together the expertise of different teams at Urban to work together and see things differently. And in the end, we feel it improved our process and the ultimate product.
Bill Pitkin
Increased demand and support for upward mobility work
The October 2024 Data Dashboard launch event broke the Urban Institute’s all-time record for event attendance, with more than 1,700 people joining, and in the first six months after launch, more than 15,000 total users have accessed the Dashboard. The Upward Mobility Initiative website has seen an increases in overall user traffic (125% increase in the past six months over the previous six months), subscriptions to the project newsletter have grown significantly, and over 1,900 people have attended upward mobility workshops over the past year.

We’ve been getting so much excitement and demand for upward mobility work since the launch event for the data dashboard, which had more than 1,700 people! The momentum has been really strong.
Keith Fudge
Team & Studio Impact
In many of our projects, we lead all aspects of the design process and deliverables. However, due to the scale and complexity of this initiative, our team was part of a larger, cross-functional, and cross-organizational collaboration. In this context, our primary responsibility was to guide the co-creative, iterative prototyping process and design the user experience (UX) for the data dashboard. Working alongside several distributed teams at Urban and an external development partner, we were reminded of the critical importance of:
- Establishing shared expectations around team roles, communication channels, and decision-making processes
- Proactively identifying and communicating necessary inputs and potential blockers that could impact deliverables
- Purposefully planning collaboration time at key project touchpoints to ensure alignment and maintain momentum
While these practices are foundational to all of our partnerships, this project helped us to refine and expand our strategies for contributing effectively within a larger, more complex team structure.
Fun fact: We have been able to utilize the Upward Mobility Data Dashboard and the Mobility Metrics data for several other community development projects at GGS!